SOCIAL RESPONSABILITY
AND SUSTAINABILITY
REPORT
2018
34
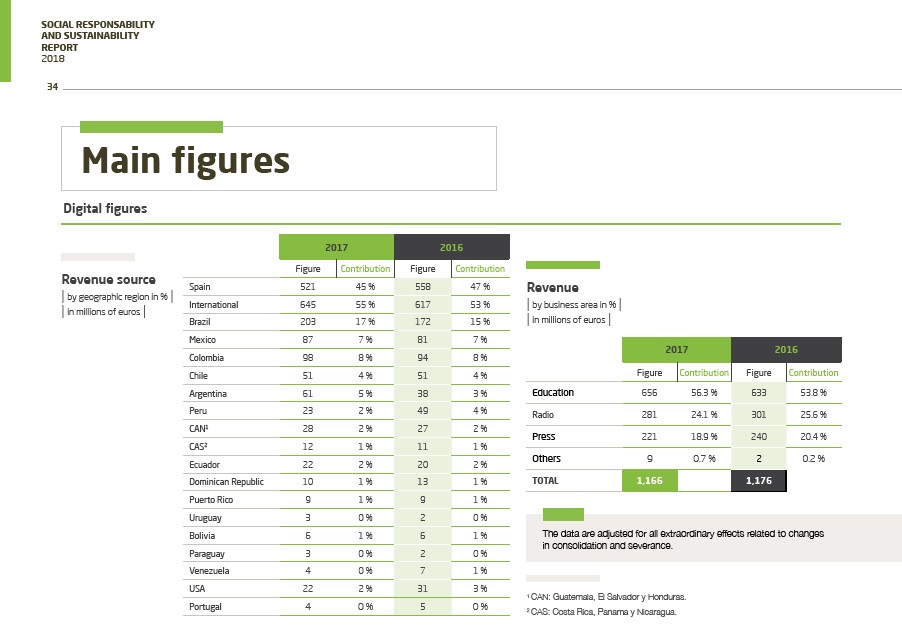
Revenue
| by business area in % |
| in millions of euros |
2017 2016
Figure Contribution Figure Contribution
Education 656 56.3 % 633 53.8 %
Radio 281 24.1 % 301 25.6 %
Press 221 18.9 % 240 20.4 %
Others 9 0.7 % 2 0.2 %
TOTAL 1,166 1,176
The data are adjusted for all extraordinary effects related to changes
in consolidation and severance.
Main figures
Revenue source
| by geographic region in % |
| in millions of euros |
2017 2016
Figure Contribution Figure Contribution
Spain 521 45 % 558 47 %
International 645 55 % 617 53 %
Brazil 203 17 % 172 15 %
Mexico 87 7 % 81 7 %
Colombia 98 8 % 94 8 %
Chile 51 4 % 51 4 %
Argentina 61 5 % 38 3 %
Peru 23 2 % 49 4 %
CAN1 28 2 % 27 2 %
CAS2 12 1 % 11 1 %
Ecuador 22 2 % 20 2 %
Dominican Republic 10 1 % 13 1 %
Puerto Rico 9 1 % 9 1 %
Uruguay 3 0 % 2 0 %
Bolivia 6 1 % 6 1 %
Paraguay 3 0 % 2 0 %
Venezuela 4 0 % 7 1 %
USA 22 2 % 31 3 %
Portugal 4 0 % 5 0 %
Digital figures
1 CAN: Guatemala, El Salvador y Honduras.
2 CAS: Costa Rica, Panama y Nicaragua.