82 SOCIAL RESPONSABILITY
AND SUSTAINABILITY
REPORT
2018
1.35
1.35
1.96
1.00
1.00
4.13
1.02
1.00
1.21
1.25
10.96
1.00
1.00
1.00
1.00
2.25
1.00
2.25
1.00
2.19
1.00
1.00
6.10
1.02
1.00
1.21
1.25
13.35
1.00
1.00
1.00
1.00
2.35
1.00
2.25
1.00
Argentina
Bolivia
Brazil
Northern Central America
Chile
Colombia
Costa Rica
Ecuador
Spain
Mexico
Panama
Paraguay
Peru
Portugal
Puerto Rico
Dominican Republic
Uruguay
USA
Venezuela
0 2 4 6 8 10 12 14
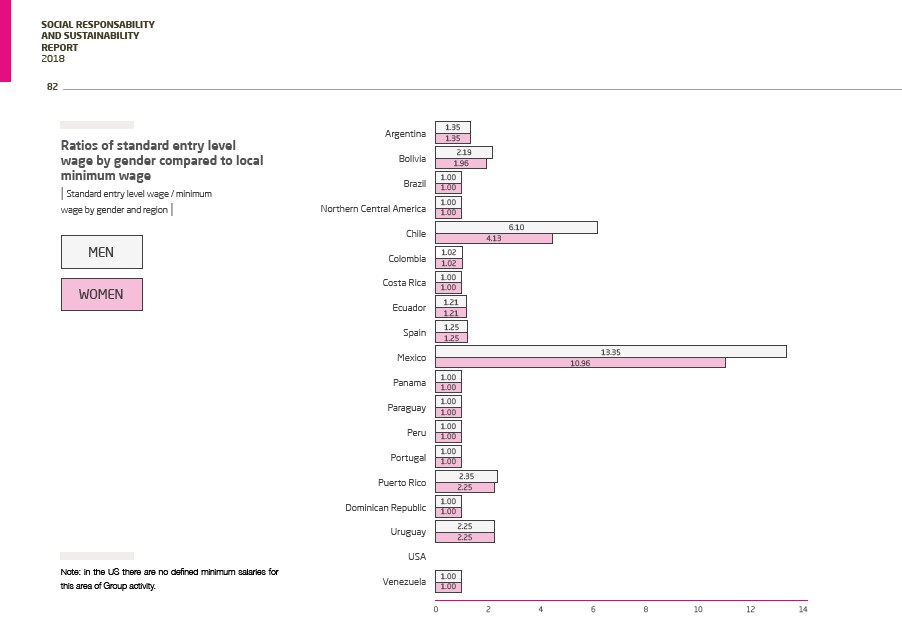
Ratios of standard entry level
wage by gender compared to local
minimum wage
| Standard entry level wage / minimum
wage by gender and region |
MEN
WOMEN
Note: in the US there are no defined minimum salaries for
this area of Group activity.