SOCIAL RESPONSABILITY
AND SUSTAINABILITY
REPORT
2018
WOMEN
45 76
121 30 18
PUERTO RICO
TOTAL
31 33
VENEZUELA
64
48
DOMINICAN REP.
536 727
COLOMBIA
19 18
BOLIVIA
138 165
19 18
PARAGUAY
453 357
BRAZIL
11 9
262 215
ARGENTINA
477
37
45 58
USA
265 296
MEXICO
31 41
COSTA RICA
72
12 24
PANAMA
36
URUGUAY
20
1,263
46 72
ECUADOR
118
561
37
1,398 1,689
SPAIN
3,087
MEN
473 637
PORTUGAL
1,110
PERU
303
132 229
CHILE
361
810
73 77
CAN1
150
103
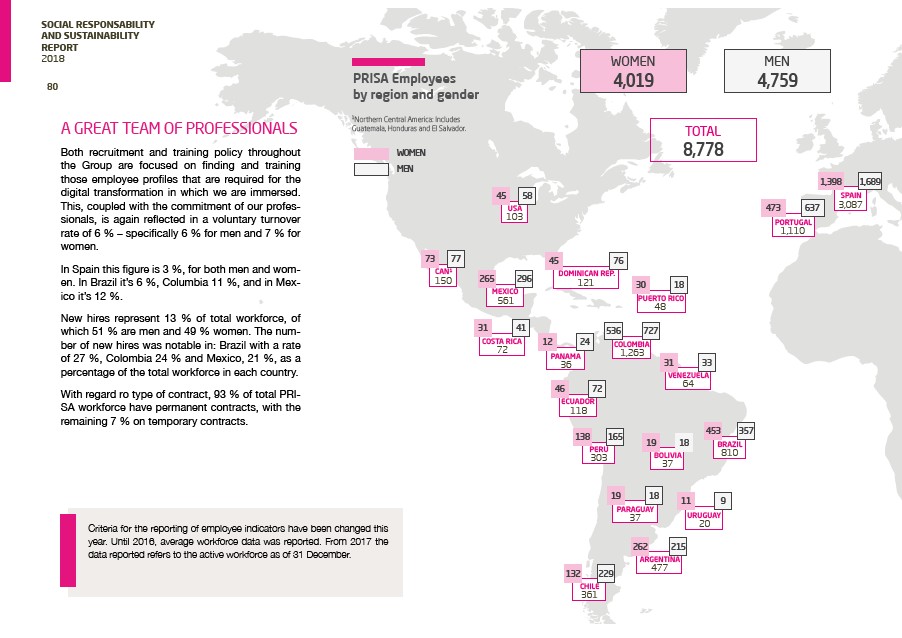
PRISA Employees
by region and gender
1Northern Central America: Includes
Guatemala, Honduras and El Salvador.
4,019
4,759
8,778
80
A GREAT TEAM OF PROFESSIONALS
Both recruitment and training policy throughout
the Group are focused on finding and training
those employee profiles that are required for the
digital transformation in which we are immersed.
This, coupled with the commitment of our professionals,
is again reflected in a voluntary turnover
rate of 6 % – specifically 6 % for men and 7 % for
women.
In Spain this figure is 3 %, for both men and women.
In Brazil it’s 6 %, Columbia 11 %, and in Mexico
it’s 12 %.
New hires represent 13 % of total workforce, of
which 51 % are men and 49 % women. The number
of new hires was notable in: Brazil with a rate
of 27 %, Colombia 24 % and Mexico, 21 %, as a
percentage of the total workforce in each country.
With regard ro type of contract, 93 % of total PRISA
workforce have permanent contracts, with the
remaining 7 % on temporary contracts.
Criteria for the reporting of employee indicators have been changed this
year. Until 2016, average workforce data was reported. From 2017 the
data reported refers to the active workforce as of 31 December.
WOMEN
MEN