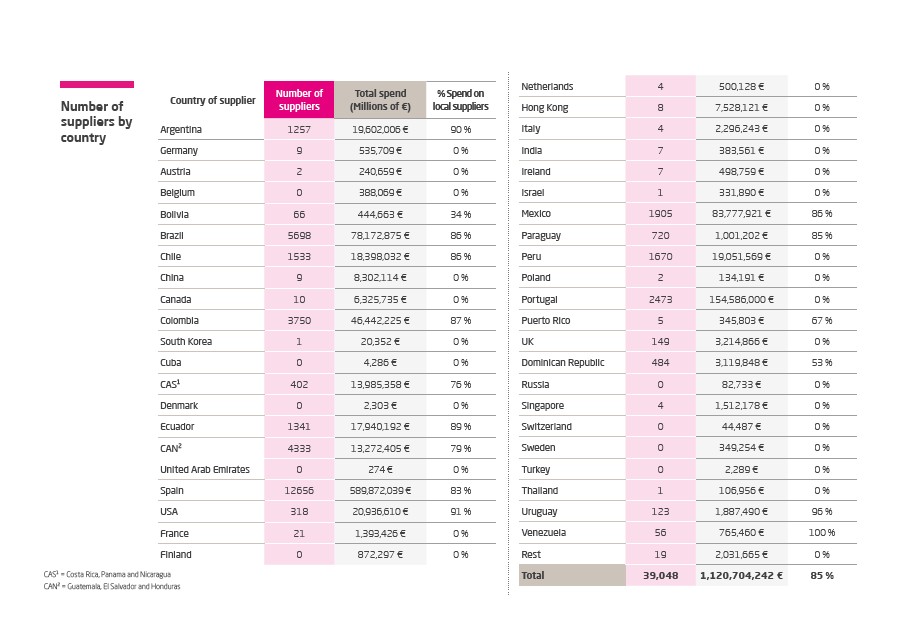
Country of supplier
Number of
suppliers
Total spend
(Millions of €)
% Spend on
local suppliers
Argentina 1257 19,602,006 € 90 %
Germany 9 535,709 € 0 %
Austria 2 240,659 € 0 %
Belgium 0 388,069 € 0 %
Bolivia 66 444,663 € 34 %
Brazil 5698 78,172,875 € 86 %
Chile 1533 18,398,032 € 86 %
China 9 8,302,114 € 0 %
Canada 10 6,325,735 € 0 %
Colombia 3750 46,442,225 € 87 %
South Korea 1 20,352 € 0 %
Cuba 0 4,286 € 0 %
CAS1 402 13,985,358 € 76 %
Denmark 0 2,303 € 0 %
Ecuador 1341 17,940,192 € 89 %
CAN2 4333 13,272,405 € 79 %
United Arab Emirates 0 274 € 0 %
Spain 12656 589,872,039 € 83 %
USA 318 20,936,610 € 91 %
France 21 1,393,426 € 0 %
Finland 0 872,297 € 0 %
Netherlands 4 500,128 € 0 %
Hong Kong 8 7,528,121 € 0 %
Italy 4 2,296,243 € 0 %
India 7 383,561 € 0 %
Ireland 7 498,759 € 0 %
Israel 1 331,890 € 0 %
Mexico 1905 83,777,921 € 86 %
Paraguay 720 1,001,202 € 85 %
Peru 1670 19,051,569 € 0 %
Poland 2 134,191 € 0 %
Portugal 2473 154,586,000 € 0 %
Puerto Rico 5 345,803 € 67 %
UK 149 3,214,866 € 0 %
Dominican Republic 484 3,119,848 € 53 %
Russia 0 82,733 € 0 %
Singapore 4 1,512,178 € 0 %
Switzerland 0 44,487 € 0 %
Sweden 0 349,254 € 0 %
Turkey 0 2,289 € 0 %
Thailand 1 106,956 € 0 %
Uruguay 123 1,887,490 € 96 %
Venezuela 56 765,460 € 100 %
Rest 19 2,031,665 € 0 %
Total 39,048 1,120,704,242 € 85 %
Number of
suppliers by
country
CAS1 = Costa Rica, Panama and Nicaragua
CAN2 = Guatemala, El Salvador and Honduras